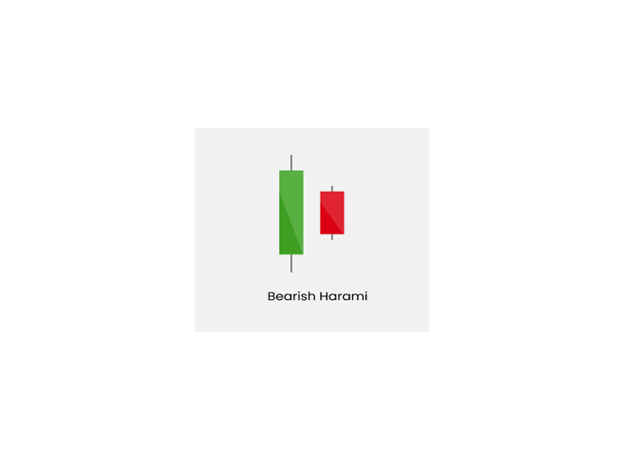
The Bearish Harami Pattern
The bearish harami pattern is a two-day candlestick pattern that indicates a potential reversal of a bullish trend in a stock or index. When this pattern appears at the top of an uptrend, it is considered a bearish reversal pattern. The bearish harami pattern is composed of a white candle with a large body, followed by a black candle with a small body that is enclosed within the body of the prior candle. This small black candle opens with a downward gap near the mid-range of the previous white candle and closes inside the white candle, signifying a changing momentum.
It is important to note that the bearish harami pattern should not be solely relied upon as a confirmation of a downtrend. Instead, it should be considered in conjunction with other factors. To confirm the pattern, the price should trade and remain below the harami pattern low in the following days. Additionally, it is recommended to evaluate other technical parameters before entering into a trade based solely on the bearish harami pattern.