
NIFTY TECHNICAL OUTLOOK
Based on Market Closing on Tuesday, April 09, 2024
In the last trading session, the Nifty reached a record high of 22,768.40 before closing at 22,642.75, experiencing a minor decline of 23.55 points or -0.10 percent. To sustain a positive trend, the Nifty needs to maintain trading above the 21,620 level.
The trading session commenced with the Nifty opening at 22,765.10, displaying a positive sentiment. The index surged to a record high of 22,768.40 during morning trade. However, the momentum faltered, resulting in a gradual decline, reaching an intraday low of 22,612.30 before closing at 22,642.75. Sector-wise, metal, real estate, private banks, and financial services showed significant gains, while media, PSU banks, FMCGs, and autos experienced losses. The market breadth leaned towards negativity, with 973 stocks rising, 1,473 falling, and 142 remaining unchanged. Prominent gainers within the Nifty included APOLLOHOSP, HINDALCO, ICICIBANK, and BAJAJFINSV, whereas major losers comprised TITAN, COALINDIA, HEROMOTOCO, and RELIANCE.
Technically, the Nifty maintains positions above both short-term and long-term moving averages, with momentum indicators reflecting a positive trend. However, the formation of a black candle on the daily chart, coupled with a close near the day's low, suggests potential weakness. Intraday support for the Nifty stands at 22,620; a breach of this level could signal a continuation of the downtrend. Conversely, if nifty stays above this level, a rebound rally may be anticipated from this support zone.
Intraday Levels: Support - 22,620, 22,550, 22,460 Resistance - 22,700, 22,775, 22,850
(15-Minute Charts)
Positional Trading: Short-term Support - 22,500-21,850 Resistance - 23,000-23,500.
BANK NIFTY OUTLOOK
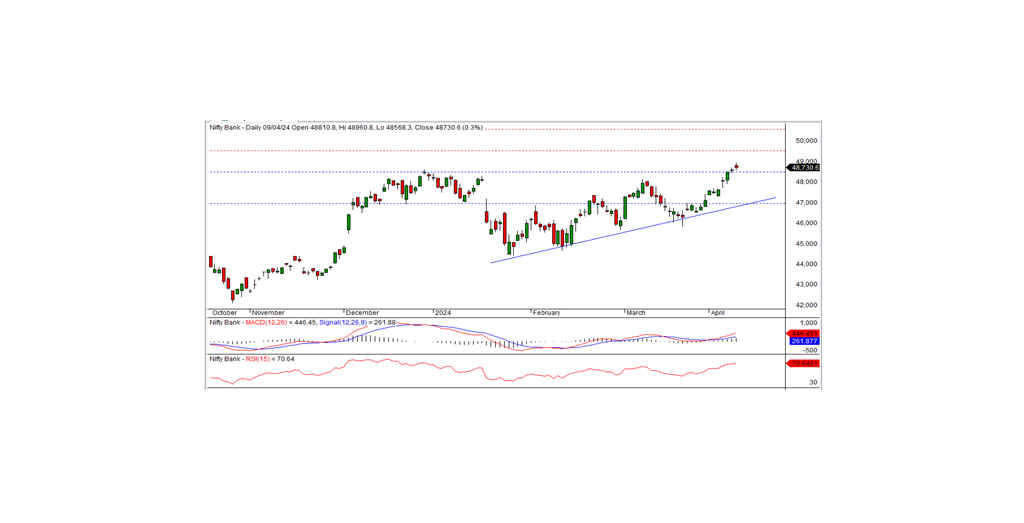
During the preceding trading session, Bank Nifty achieved a record high, closing at 48,730.60, marking a gain of 148.85 points. Momentum indicators continue to signal a positive trend, with the index maintaining positions above both short-term and long-term moving averages. Despite the formation of a small black candle on the daily chart, the index closed at a new high, suggesting potential for further upward movement.
On the upside, the index faces intraday resistance at 49,000. A breach of this level could extend the bullish trend in the coming days. The subsequent short-term resistance lies at 49,500 levels.
For intraday traders, support levels are identified at 48,680, 48,450, and 48,200, while resistance levels can be found at 48,950, 49,200, and 49,400, as observed on the 15-minute charts.
Positional traders are advised to monitor short-term support levels at 48,500-47,000, with resistance at 49,500-50,500.
