NIFTY TECHNICAL OUTLOOK
Based on Market Closing on Monday, January 08, 2024
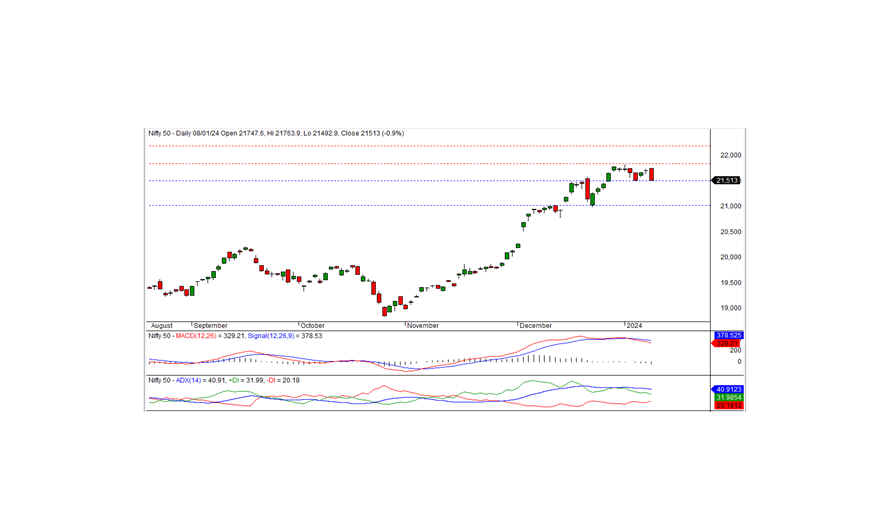
The Nifty concluded the trading session at 21513.00, registering a loss of 197.80 points or 0.91 percent. The negative bias may persist if the Nifty breaches the short-term support at 21500.
Opening at 21747.60, the Nifty displayed a positive start and reached an intraday high of 21763.90 during morning trade. However, the index later declined, hitting an intraday low of 21492.90 before closing at 21513.00. Except for realty and media, all sectors closed with a negative bias. The banking, FMCG, metal, and financial sectors experienced the most significant losses. The market breadth was negative, with 945 stocks rising, 1424 falling, and 142 remaining unchanged.
Top gainers under the Nifty included ADANI PORTS, HCLTECH, ONGC, and NTPC, while major losers were UPL, SBIN, SBILIFE, and DIVISLAB.
From a technical standpoint, the Nifty closed below the short-term moving averages, and momentum indicators signal a neutral trend. The daily chart displayed a long black candle, closed near the short-term support of 21500, indicating a negative bias. If the index trades and sustains below the support level of 21500, the downward trend may persist in the coming days. The nearest intraday resistance is observed at 21555 levels, and for a pullback rally, the index needs to surpass this level.
Intraday Support levels: 21500-21435-21370 Resistance levels: 21555-21620-21675 (15 Minute Charts)
For positional traders, short-term support levels remain at 21500-21000, with resistance at 21835-22200.

BANK NIFTY
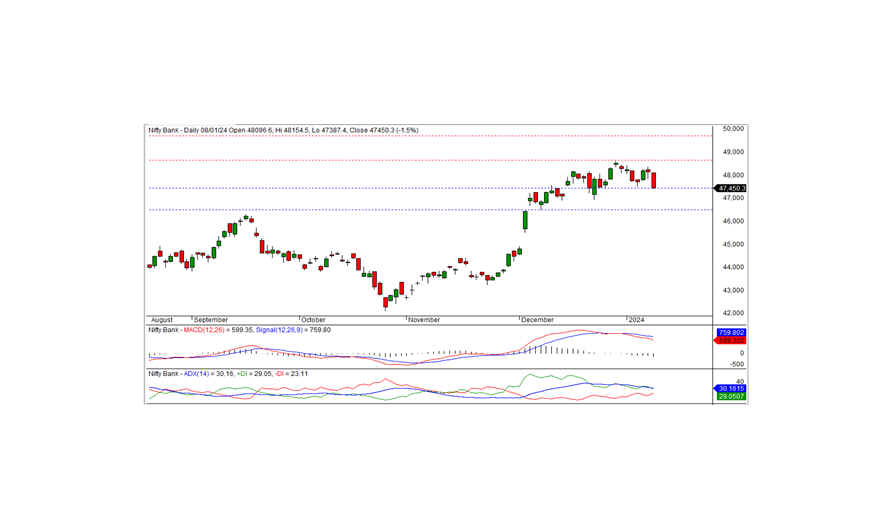
In the previous trading session, Bank Nifty concluded at 47450.25, marking a loss of -708.75 points. Analyzing from a technical standpoint, the momentum indicators suggest a negative trend, and the index closed below the short-term moving averages. Additionally, a black candle was formed on the daily chart, closing near the short-term support of 47400. If the index continues to trade and sustain below this support level, the downward trend may persist in the upcoming days. The nearest intraday resistance is identified at 47600, and for a potential pullback rally, the index must surpass this level.
For intraday traders, the support levels are situated at 47400, 47200, and 47000, while resistance levels can be observed at 47600, 47800, and 48000, as highlighted by the 15-minute charts.
Positional traders are advised to keep an eye on short-term support levels at 47400-46500, with resistance noted at 48650 - 49700.

