NIFTY TECHNICAL UPDATE
Market Analysis as of Tuesday, December 26, 2023
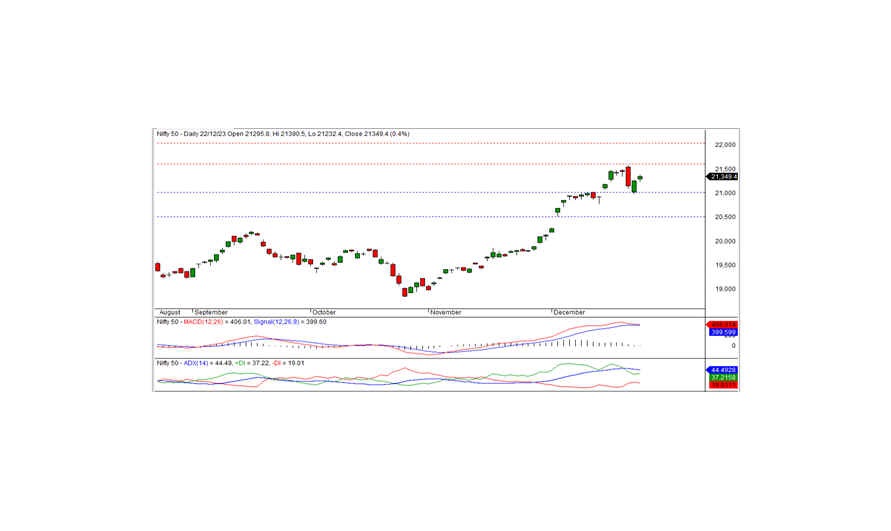
On December 22, 2023, the Nifty concluded the session at 21,349.40, exhibiting a notable gain of 93.35 points or 0.44 percent. To sustain the current bullish momentum, the index must surpass the intraday resistance at 21,400.
Initiating the day at the positive level of 21,295.80, the Nifty reached an intraday high of 21,390.50 during the morning trade. However, the index experienced a downward shift, touching the intraday low of 21,232.40 before ultimately settling at 21,349.0. Prominent sector gainers comprised realty, IT, metals, and auto, while banks and financial services witnessed declines. Market breadth reflected positivity, with 1,574 stocks on the rise, 795 on the decline, and 122 remaining unchanged.
Noteworthy gainers beneath the Nifty umbrella included WIPRO, HCLTECH, HINDALCO, and TATAMOTORS, while major losers encompassed GRASIM, SBIN, ICICIBANK, and BAJFINANCE.
From a technical perspective, the Nifty maintains its position above both short-term and long-term moving averages. Momentum indicators also affirm a positive trend. The formation of a white candle on the daily chart, closing above the preceding day's conclusion, suggests a potential continuation of the uptrend. Notably, the index faces intraday resistance at the 21,400 level, and breaching this threshold could extend the positive trend. In terms of support, the nearest intraday level stands at 21,300.
Intraday support levels are outlined as 21,300-21,200-21,100, while resistance levels are set at 21,400-21,500-21,600 (based on 15-minute charts).
For positional traders, short-term support levels are identified at 21,000-20,500, coupled with resistance levels at 21,600-22,000. Traders are advised to monitor these levels for strategic decision-making in the current market scenario.
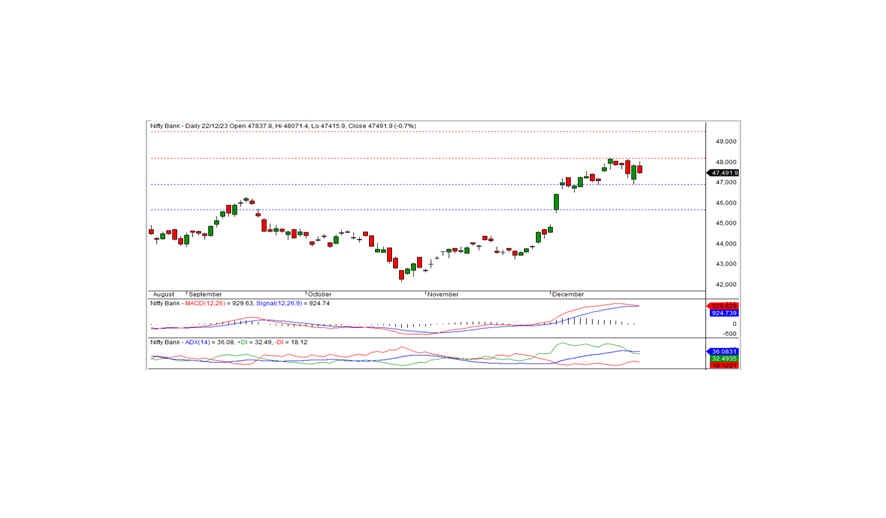
BANK NIFTY ANALYSIS
In the most recent trading session, Bank Nifty concluded at 47,491.85, marking a loss of 348.30 points. From a technical standpoint, momentum indicators suggest a positive trend, and the index maintains its position above both medium-term and long-term moving averages. However, a black candle on the daily chart, closing within the bounds of the previous day's candle, hints at potential consolidation.
On the upside, the index encounters intraday resistance at 47,720, while the support level is identified at 47,400. To initiate a pullback rally, breaching the 47,720 level is imperative. Conversely, if the index descends below the 47,400 level, the downtrend may persist.
For intraday traders, key support levels are situated at 47,400, 47,200, and 47,000, with corresponding resistance levels identified at 47,720, 48,925, and 48,165, based on insights from the 15-minute charts.
Positional traders are advised to monitor short-term support levels at 47,000-45,670, while resistance is anticipated in the range of 48,200 to 49,500. These levels should be carefully observed for informed decision-making in the current market conditions.