NIFTY TECHNICAL UPDATE - December 6, 2023
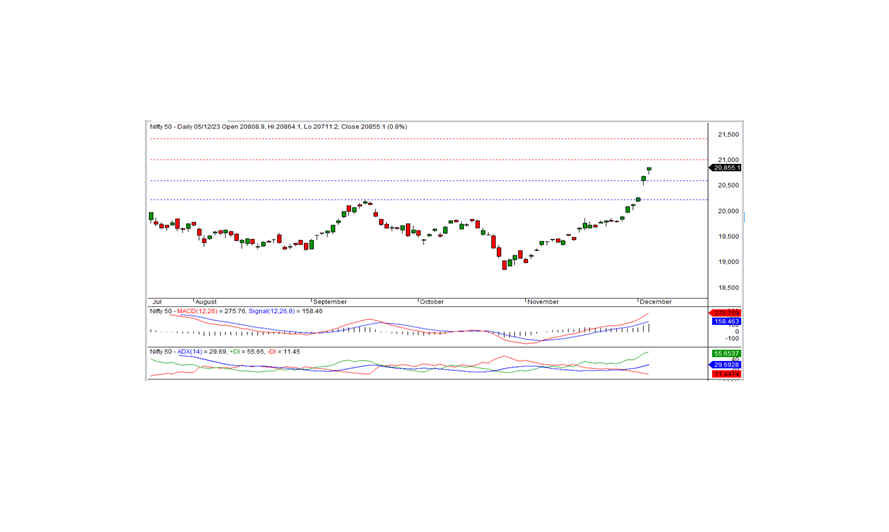
Following the market closure on Tuesday, December 5, 2023, the Nifty achieved a historic high, concluding the session at 20855.10, marking a notable gain of 168.30 points or 0.81 percent. The bullish momentum is poised to persist should the index maintain levels above 20865.
Commencing at 20808.90, the Nifty opened with a positive gap. During the session, it briefly tested an intraday low of 20711.20 before ascending to the day's pinnacle at 20864.10, ultimately settling at 20855.10. Key sector gainers included metal, banks, financial services, and auto, while media, IT, realty, and FMCG experienced a downturn. Market breadth was negative, with 1119 stocks rising, 1251 falling, and 114 remaining unchanged. Noteworthy top gainers beneath the Nifty umbrella were ADANIENT, ADANI PORTS, POWERGRID, and NTPC, while significant losers included LTIM, HCLTECH, HINDUNILVR, and DIVISLAB.
Technically, the Nifty maintains its position above both short-term and long-term moving averages, supported by positive signals from momentum indicators. The daily chart reveals the formation of a white candle at an all-time high, suggesting the potential for a continued uptrend. Notably, the index faces intraday resistance at 20865; surpassing this level could sustain the bullish trajectory in the upcoming days. The subsequent short-term resistance is anticipated at 21000.
Intraday support levels are identified at 20740, 20625, and 20500, while resistance levels stand at 20865, 21000, and 21100 based on 15-minute charts.
For positional traders, short-term support levels persist at 20600-20200, coupled with resistance levels at 21000-21400, indicating potential trading ranges for strategic decision-making.

BANK NIFTY UPDATE
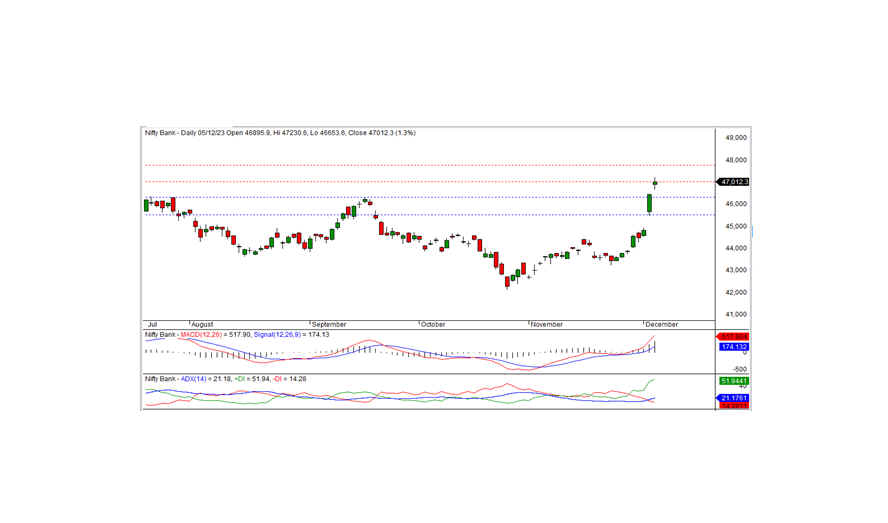
In the most recent trading session, Bank Nifty concluded at a historic high, reaching 47012.25 and registering a substantial gain of 1617.20 points. Analyzing the technical aspects, momentum indicators affirm a positive trend, with the index positioned comfortably above both short-term and long-term moving averages. Notably, the daily chart exhibits a white candle, closing well above the preceding day's high, signaling a potential continuation of the bullish trend.
During the last trading session, the index successfully closed above the critical resistance level of 47000. Sustaining this level could extend the bullish trajectory in the upcoming days. The subsequent short-term resistance is anticipated at 47750.
For intraday traders, essential support levels are identified at 46750, 46500, and 46200, while resistance levels are notable at 47175, 47500, and 47800, as indicated by the 15-minute charts.
Positional traders are advised to monitor short-term support levels at 46300-45500, with resistance levels observed at 47000-47750.

