Ascending triangle pattern
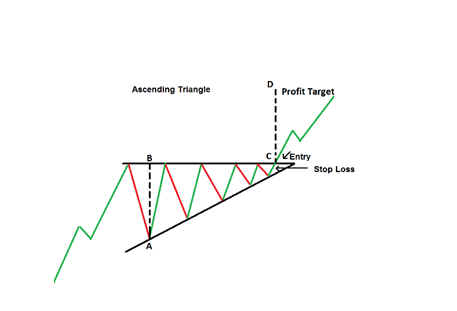
In technical analysis, an ascending triangle is a chart pattern that is formed by a horizontal line of resistance and a rising trend line of support. This pattern is considered a bullish continuation pattern, as it is typically seen as a sign that the price will continue to rise after the pattern is complete.
To take a long (buy) position with an ascending triangle, a trader would look for a bullish breakout above the horizontal resistance line of the triangle. This is seen as a sign of bullish momentum and indicates that the price is likely to continue to rise.
It's not common to take a short (sell) position with an ascending triangle as it is considered a bullish pattern. However, if the ascending triangle were to break down from the trend line support, this could be seen as a bearish signal and traders may consider taking a short position.
It's important to note that the ascending triangle is just one of many chart patterns that traders may use in their technical analysis and that other factors such as the overall trend, momentum, volume, and other technical indicators should be considered as well when making trading decisions. Additionally, it is also important to consider the volume of trades and price action during the formation of the triangle, as these can also provide insight into the potential strength of the pattern and the likelihood of a successful breakout.

