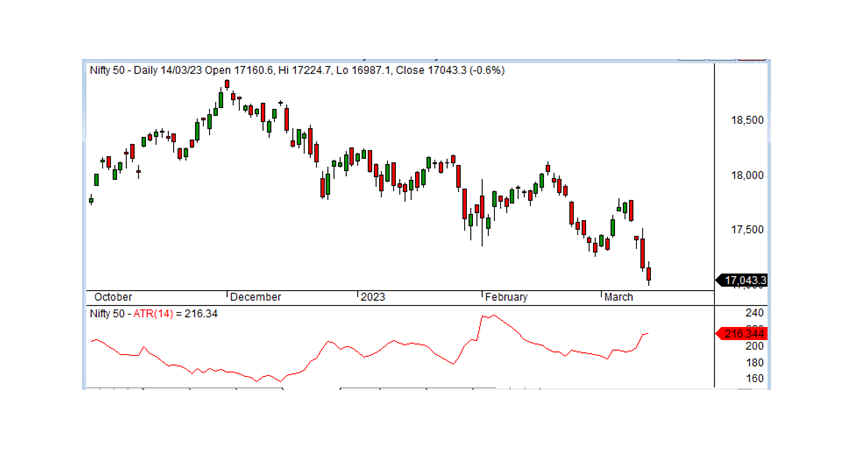
Average True Range (ATR)
The Average True Range (ATR) indicator is a technical analysis tool that measures the volatility of an asset. It was created by J. Welles Wilder Jr. and is calculated using the true range of an asset over a specified period of time. The default time period for the ATR indicator is 14 days, but it can be adjusted based on the trader's preferences.
The ATR indicator is not typically used to generate buy or sell signals on its own. Instead, it is often used to help traders set stop-loss orders and determine position size. Traders can use the ATR to calculate the average range of price movement for an asset and use this information to set stop-loss orders at an appropriate distance from the current price. This can help to limit potential losses if the price moves against the trader's position.
Additionally, the ATR can be used in conjunction with other technical indicators to identify potential trading opportunities. For example, a trader may look for periods of high volatility, as indicated by an increase in the ATR, in combination with a bullish or bearish trend identified by other indicators. This can signal a potential buying or selling opportunity but should be confirmed by other technical or fundamental analysis before taking a trade.

