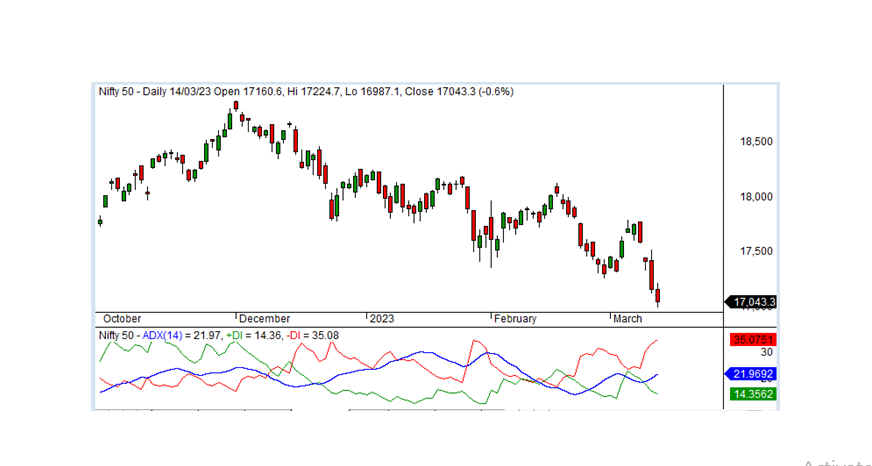
The ADX indicator
The ADX indicator's default time period is 14 periods. The ADX indicator is created by calculating the directional movement (DM) and true range (TR) for each period and then calculating the average true range (ATR) and directional index (DI) values. The ADX value is then calculated as the moving average of the DI values.
The +DI1 and -DI1 values are derived from the DI values and represent the bullish and bearish strength of the security, respectively. The +DI1 value represents the strength of the uptrend, while the -DI1 value represents the strength of the downtrend. The values range from 0 to 100, with higher values indicating stronger trends.
Traders can use the ADX indicator for buying and selling stocks by using the following strategies:
Trend strength: Traders can use the ADX value to determine the strength of the trend. A high ADX value, such as above 25, indicates a strong trend, while a low ADX value, such as below 20, indicates a weak or sideways trend. Traders may consider buying or selling the security based on the strength of the trend.
Directional movement: Traders can use the +DI1 and -DI1 values to determine the direction of the trend. If the +DI1 value is above the -DI1 value, it indicates a bullish trend, and the trader may consider buying the security. Conversely, if the -DI1 value is above the +DI1 value, it indicates a bearish trend, and the trader may consider selling the security.
Crossovers: Traders can also look for crossovers between the +DI1 and -DI1 values. If the +DI1 value crosses above the -DI1 value, it may suggest a bullish trend reversal, and the trader may consider buying the security. If the -DI1 value crosses above the +DI1 value, it may suggest a bearish trend reversal, and the trader may consider selling the security.
It is important to note that the ADX indicator, like all technical indicators, should be used in conjunction with other tools and analyses to make informed trading decisions. Additionally, traders should be aware of the limitations of the indicator, such as its tendency to give false signals in choppy or sideways markets.

