NIFTY TECHNICAL UPDATE
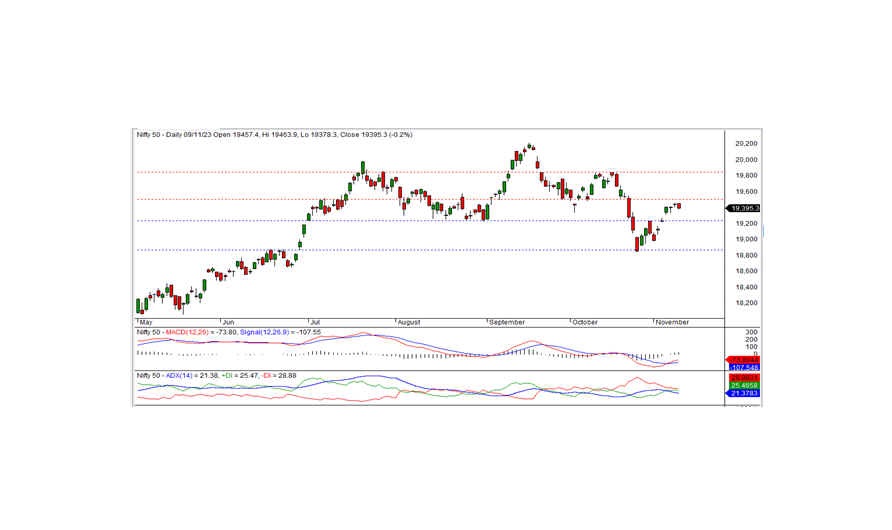
As of Thursday's market close on November 9, 2023, the Nifty concluded at 19395.30, showing a decline of -48.20 points or -0.25 percent. To establish a positive trend, it is crucial for the Nifty to consistently trade above 19400.
The day started on a positive note, opening at 19457.40 with an optimistic bias and reaching an intraday high of 19463.90 during the morning trade. However, the index gradually retreated, hitting the intraday low of 19378.30 before closing at 19395.30. Prominent sector performers included realty, auto, and private banks, whereas FMCG, IT, metal, and media encountered significant losses.
Market breadth leaned towards the negative side, with 955 stocks on the rise, 1352 falling, and 178 remaining unchanged. Top gainers under the Nifty included M&M, APOLLOHOSP, COALINDIA, and POWERGRID, while ADANIENT, HINDUNILVR, ADANIPORTS, and TATACONSUM were among the major losers.
From a technical standpoint, the Nifty maintains a position above short-term moving averages, and momentum indicators signal a positive trend. However, a black candle formation on the daily chart following the previous day's Doji candle suggests a slight negative bias. The nearest intraday resistance stands at the 19400 level, and breaching this level is essential for sustaining a positive trend. Failure to do so may lead to a continuation of the downtrend.
Intraday Support Levels: 19350-19300-19270 Resistance Levels: 19400-19465-19510 (15 Minute Charts)
For positional traders, short-term support levels are identified at 19233-18880, while resistance is observed at 19500-19800.

BANK NIFTY
In the last trading session, Bank Nifty concluded at 43683.60, securing a gain of 24.95 points. Analyzing it from a technical standpoint, momentum indicators point towards a positive trend, with the index positioned above short-term moving averages.
On the daily chart, the index formed a white candle, closing above the previous day's mark, signaling a positive bias. The immediate intraday resistance stands at 43700. A breakthrough at this level could sustain the positive momentum in the upcoming days, while a failure may result in a mildly negative trend. The subsequent intraday support is at 43550 levels.
For intraday traders, key support levels are at 43550, 43415, and 43300, with resistance levels marked at 43700, 43860, and 44000, as per the 15-minute charts.
Positional traders are advised to monitor short-term support levels at 43500-42800, with resistance in the range of 44000 to 44650.

