NIFTY Technical Outlook
Based on Market Closing on Tuesday, June 04, 2024
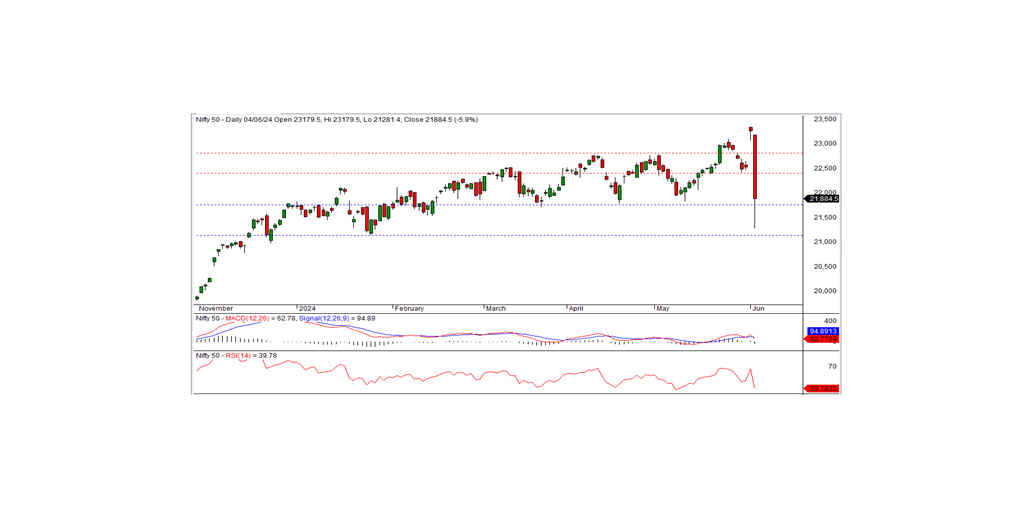
In the last trading session, the Nifty closed at 21,884.50, down by 1,379.40 points or 5.93%. The downtrend will continue if the index moves below the short-term support level of 21,750.
The Nifty opened at 23,179.50 with a negative bias, continuing to an intraday low of 21,281.40. However, the index recovered in the afternoon and closed at 21,884.50. All sectors except FMCG closed with a negative bias, with banks, metals, real estate, and financial services being the biggest losers. The market breadth was negative, with 219 stocks rising, 2,300 falling, and 91 remaining unchanged. The top gainers were HINDUNILVR, NESTLEIND, BRITANNIA, and HEROMOTOCO, while the major losers included ADANIPORTS, ADANIENT, ONGC, and NTPC.
From a technical standpoint, momentum indicators signal a negative trend. The Nifty closed below both short-term and medium-term moving averages. A long black candle was formed on the daily chart and closed well below the previous day's close. All these indicate a negative bias for the index. On the downside, the index has short-term support at 21,750. If it closes below this level, the bearish trend will continue. The nearest intraday resistance is at 22,250. For a pullback rally, the index needs to surpass this level.
Intraday Levels: Support: 21,800, 21,525, 21,300 Resistance: 22,250, 22,550-22,835 (15-Minute Charts)
Positional Trading: Short-term support: 21,750-21,150 Resistance: 22,400-22,800
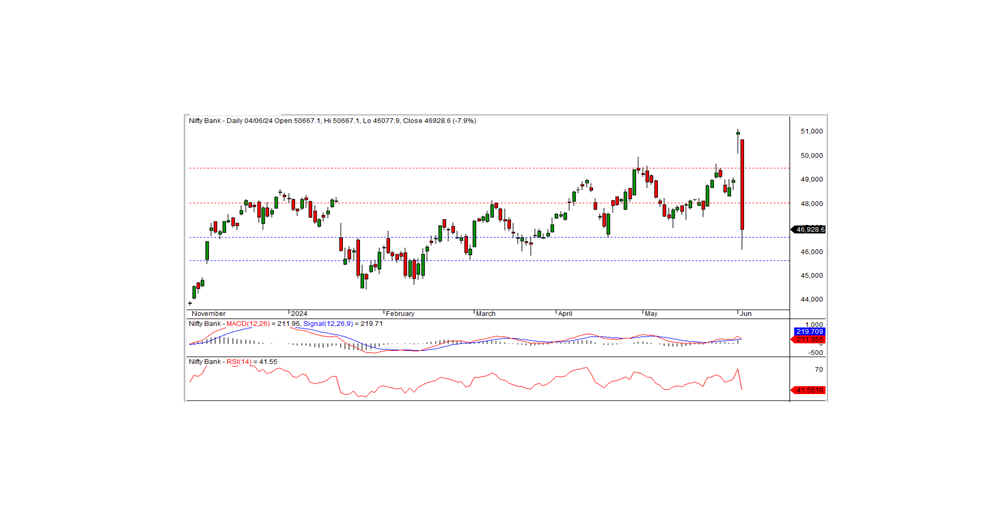
BANK NIFTY
In the preceding trading session, Bank Nifty closed at 46,928.60, registering a loss of 4,051.35 points. Technically, momentum indicators signal a negative trend, and the index closed below both medium-term and short-term moving averages. Additionally, the index formed a long black candle on the daily chart, closing well below the previous day's close.
On the downside, the 46,600 level acts as the nearest support for the index. If the index closes below this level, the bearish trend will continue in the coming days. Otherwise, a pullback rally can be anticipated from the support level. The nearest intraday resistance is at 47,650.
Intraday Levels: Support: 46,800, 46,100, 45,500 Resistance: 47,650, 48,275, 49,000 (15-Minute Charts)
Positional Trading: Short-term support: 46,600-45,600 Resistance: 48,000-49,500