NIFTY TECHNICAL OUTLOOK
Based on Market Closing on Monday, June 03, 2024
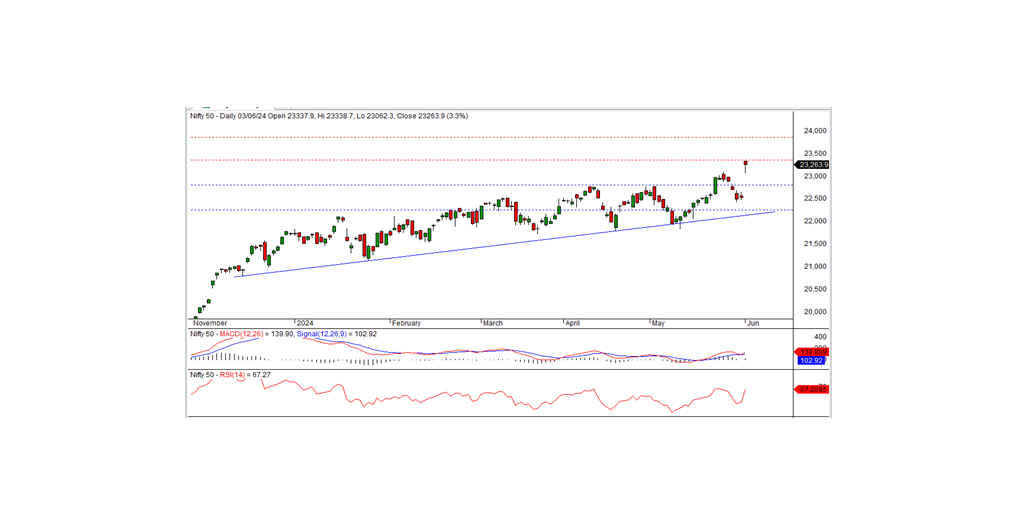
In the last trading session, the Nifty opened with a significant upward gap, testing a record high of 23,338.70, and finally closed at 23,263.90, up 733.20 points or 3.25 percent. The bullish trend will continue if the index moves above the previous day's high of 23,338.70.
The Nifty opened at 22,337.90, a positive gap, and then hit an intraday low of 23,062.30 in the morning trade. Subsequently, the index rose and closed at 23,263.90, near the record high. All sectors closed positively, with the top gainers being banks, realty, financial services, and metal sectors. The market breadth was positive, with 1,606 stocks rising, 895 falling, and 108 remaining unchanged. The top gainers in the Nifty were ADANI PORTS, NTPC, SBIN, and POWERGRID, while the major losers included EICHERMOT, LTIM, HCLTECH, and ASIANPAINT.
From a technical standpoint, momentum indicators signal a positive trend. The Nifty remains above both short-term and long-term moving averages. In the last session, the index formed a small black candle on the daily chart but closed near the record high. The long lower shadow of the candle indicates buying interest near the support zone. On the higher side, the record high level of 23,338.70 acts as the nearest resistance for the index. If the index surpasses this level, the bullish trend will continue in the coming days. The nearest short-term support remains in the 23,000-22,800 area.
Intraday Levels: Support: 23,200, 23,060, 22,960 Resistance: 23,340, 23,450-23,600 (15-Minute Charts)
Positional Trading: Short-term Support: 22,800-22,250 Resistance: 23,340-23,850.
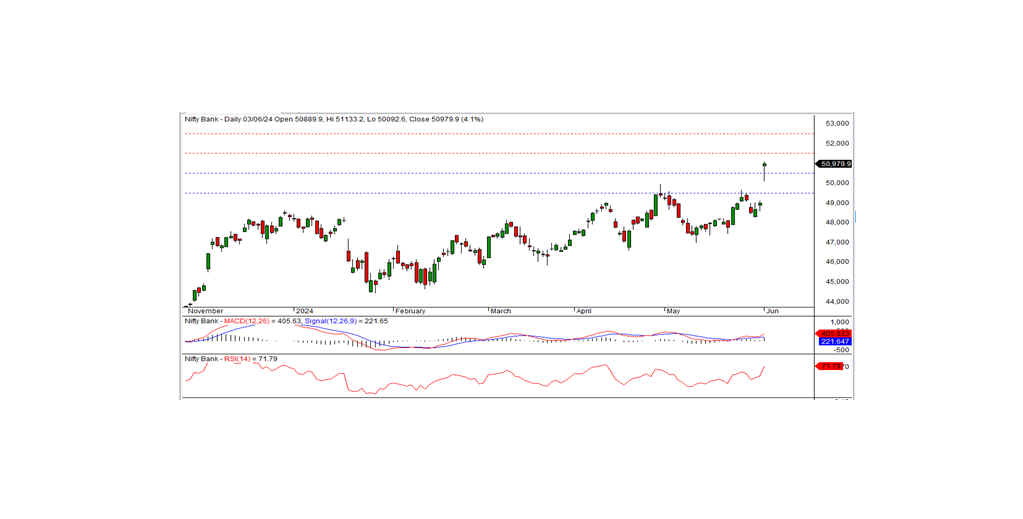
BANK NIFTY TECHNICAL OUTLOOK
In the preceding trading session, Bank Nifty closed at a record high of 50,979.90, registering a gain of 1,996.00 points. Technically, momentum indicators signal a positive trend, and the index remains above both medium-term and long-term moving averages. Additionally, the index formed a white candle on the daily chart and closed well above the previous day's close, suggesting the possibility of a continuing bullish trend.
On the higher side, the record high of 51,133 acts as the nearest resistance for the index. If the index surpasses this level, the bullish trend is likely to continue in the coming days. The nearest short-term support is at 50,500 levels.
Intraday Levels - Support: 50,730, 50,375, 50,000 Resistance: 51,150, 51,500, 51,850 (15-Minute Charts)
Positional Trading - Short-term Support: 50,500-49,500 Resistance: 51,500-52,500