Nifty Technical Outlook
Based on Market Closing on Thursday, October 3, 2024
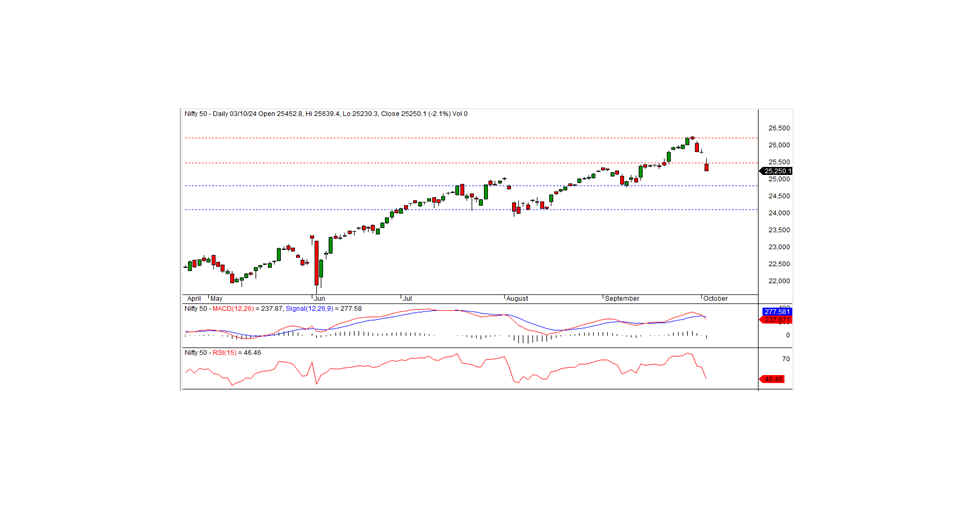
In the latest trading session, the Nifty closed at 25,250.10, down by 546.80 points, or -2.21%. The market remains under bearish pressure, and further downside is likely if the index breaches the intraday support level at 25,200.
Nifty opened the session with a downward gap at 25,452.80. After testing an intraday high of 25,639.40 during morning trade, the index witnessed a sharp decline, hitting an intraday low of 25,230.30 before settling at 25,250.10. All sectors ended the session with a negative bias, with real estate, auto, private banks, and financial services suffering the biggest losses. Market breadth was distinctly negative, as only 512 stocks advanced, while 2,079 declined, and 142 remained unchanged. The top gainers were JSW Steel and ONGC, while BPCL, Shriram Finance, L&T, and Axis Bank were the biggest losers.
From a technical perspective, momentum indicators continue to signal a bearish trend, with the Nifty closing below its short-term moving averages. The index also formed a black candle on the daily chart, closing well below the previous session’s low. These factors suggest the momentum remains strongly in favor of the bears.
On the downside, immediate intraday support lies at 25,200. A break below this level could intensify the negative trend. On the upside, the nearest intraday resistance is at 25,300. For any meaningful pullback, the index would need to surpass this level.
Intraday Levels: Support: 25,200, 25,100, 25,000 Resistance: 25,300, 25,400–25,500 (15-Minute Charts)
Positional Trading Levels: Short-term support: 24,800–24,100 Resistance: 25,500–26,275
Bank Nifty Technical Outlook
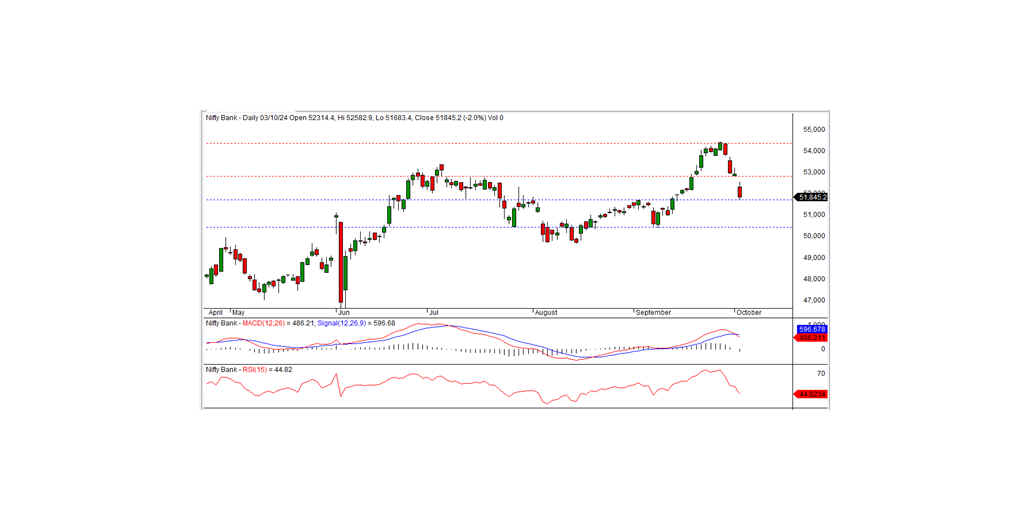
In the previous trading session, Bank Nifty closed at 51,845.20, marking a loss of 1,077.40 points. Technically, momentum indicators point to a bearish trend, with the index trading below its short-term moving averages. Additionally, Bank Nifty formed a black candle on the daily chart, closing below the prior session’s close, which suggests a continuation of the downward bias.
On the downside, the index has immediate intraday support at 51,675, while resistance is seen at 52,000. A move below the 51,675 support level could lead to further declines. Conversely, a pullback rally is possible if the index trades above and sustains the 52,000 resistance level.
Intraday Levels (15-Minute Charts): Support: 51,675, 51,425, 51,150 Resistance: 52,000, 52,250, 52,500
Positional Trading Levels: Short-term support: 51,700–50,400 Resistance: 52,800–54,350