NIFTY TECHNICAL OUTLOOK
Based on Market Closing on Monday, June 10, 2024
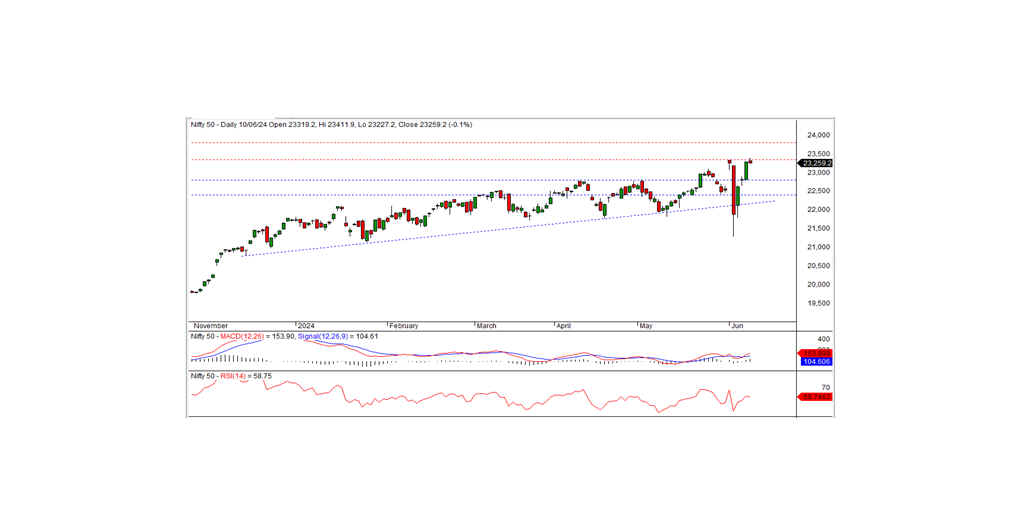
In the last trading session, the Nifty reached a record high of 23,411.90 but closed at 23,259.20, down 30.95 points or 0.13 percent. To continue the uptrend, the index must close above the short-term resistance level of 23,340.
Nifty opened at 23,319.20 with a positive bias, continuing the trend and testing the record high of 23,411.90 in the morning trade. However, it failed to maintain momentum, hitting an intraday low of 23,227.20 before closing at 23,259.20. The biggest gainers were the media, realty, pharma, and PSU bank sectors, while the major losers were IT, metal, private banks, and financial services. Market breadth was positive, with 1,713 stocks rising, 822 falling, and 79 remaining unchanged. The top gainers in the Nifty were ULTRACEMCO, GRASIM, HEROMOTOCO, and CIPLA, while the major losers included TECHM, INFY, WIPRO, and M&M.
From a technical standpoint, momentum indicators signal a positive trend. The Nifty remains above both long-term and short-term moving averages. However, the index formed a small black candle on the daily chart and closed below the previous day's close, indicating a slightly negative bias. On the higher side, the index faces short-term resistance at 23,340. To continue the bullish trend, the index needs to close above this level. The nearest intraday support is at 23,150.
Intraday Levels: Support: 23,150, 22,900, 22,700 Resistance: 23,340, 23,550-23,750 (15-Minute Charts)
Positional Trading: Short-term Support: 22,800-22,400 Resistance: 23,340-23,800
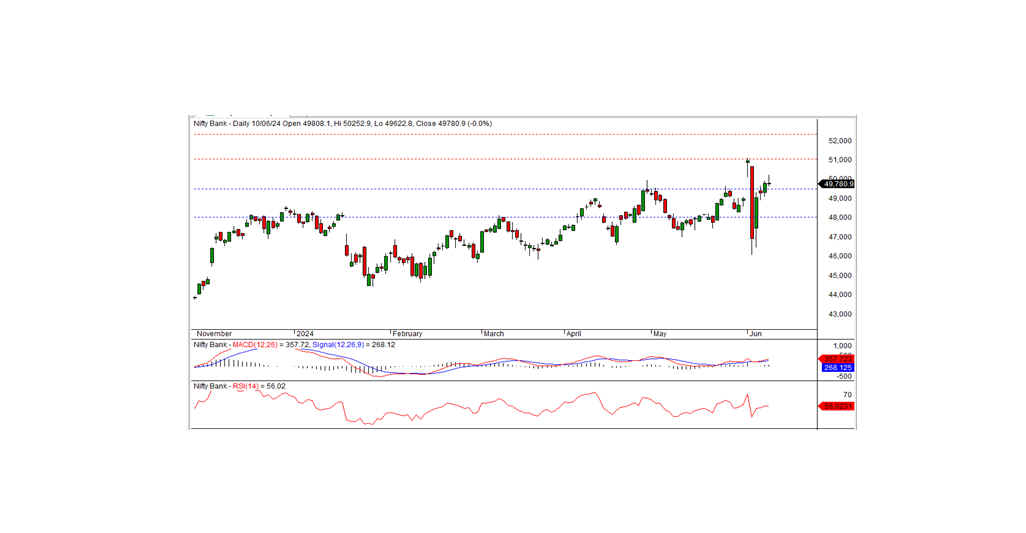
BANK NIFTY TECHNICAL OUTLOOK
In the preceding trading session, Bank Nifty closed at 49,790.90, registering a loss of 22.30 points. Technically, the momentum indicators signal a positive trend, and the index remains above the medium-term and short-term moving averages. However, the index formed a Doji candle on the daily chart and closed just below the previous day's close, indicating the possibility of consolidation.
On the higher side, the 50,100 level acts as the nearest intraday resistance for the index. If the index closes above this level, the positive trend is likely to continue in the coming days. Otherwise, the index may consolidate below this level for a few days. The nearest short-term support is at 49,500.
Intraday Levels: Support: 49,600, 49,100, 48,655 Resistance: 50,100, 50,500, 51,100 (15-Minute Charts)
Positional Trading: Short-term Support: 49,500-48,000 Resistance: 51,000-52,300